The ads table is the first starting point to visualizing multi channel ad data.
Learn how to customize your tables in order to organize all your paid ad data for easier management. You can check it conveniently at any time, and may even share it with your team members.
Adriel BI offers a variety of tables. The ads tables discussed here can be distinguished from other customized tables and small table with the Ads icon mentioned next to the table heading. 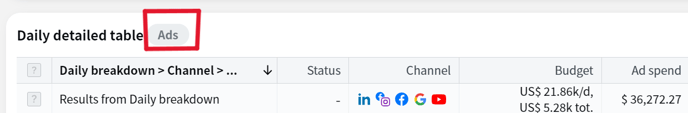
How do I create a table?
1. From the left hand navigation bar, select or create a view where you want to add a table.
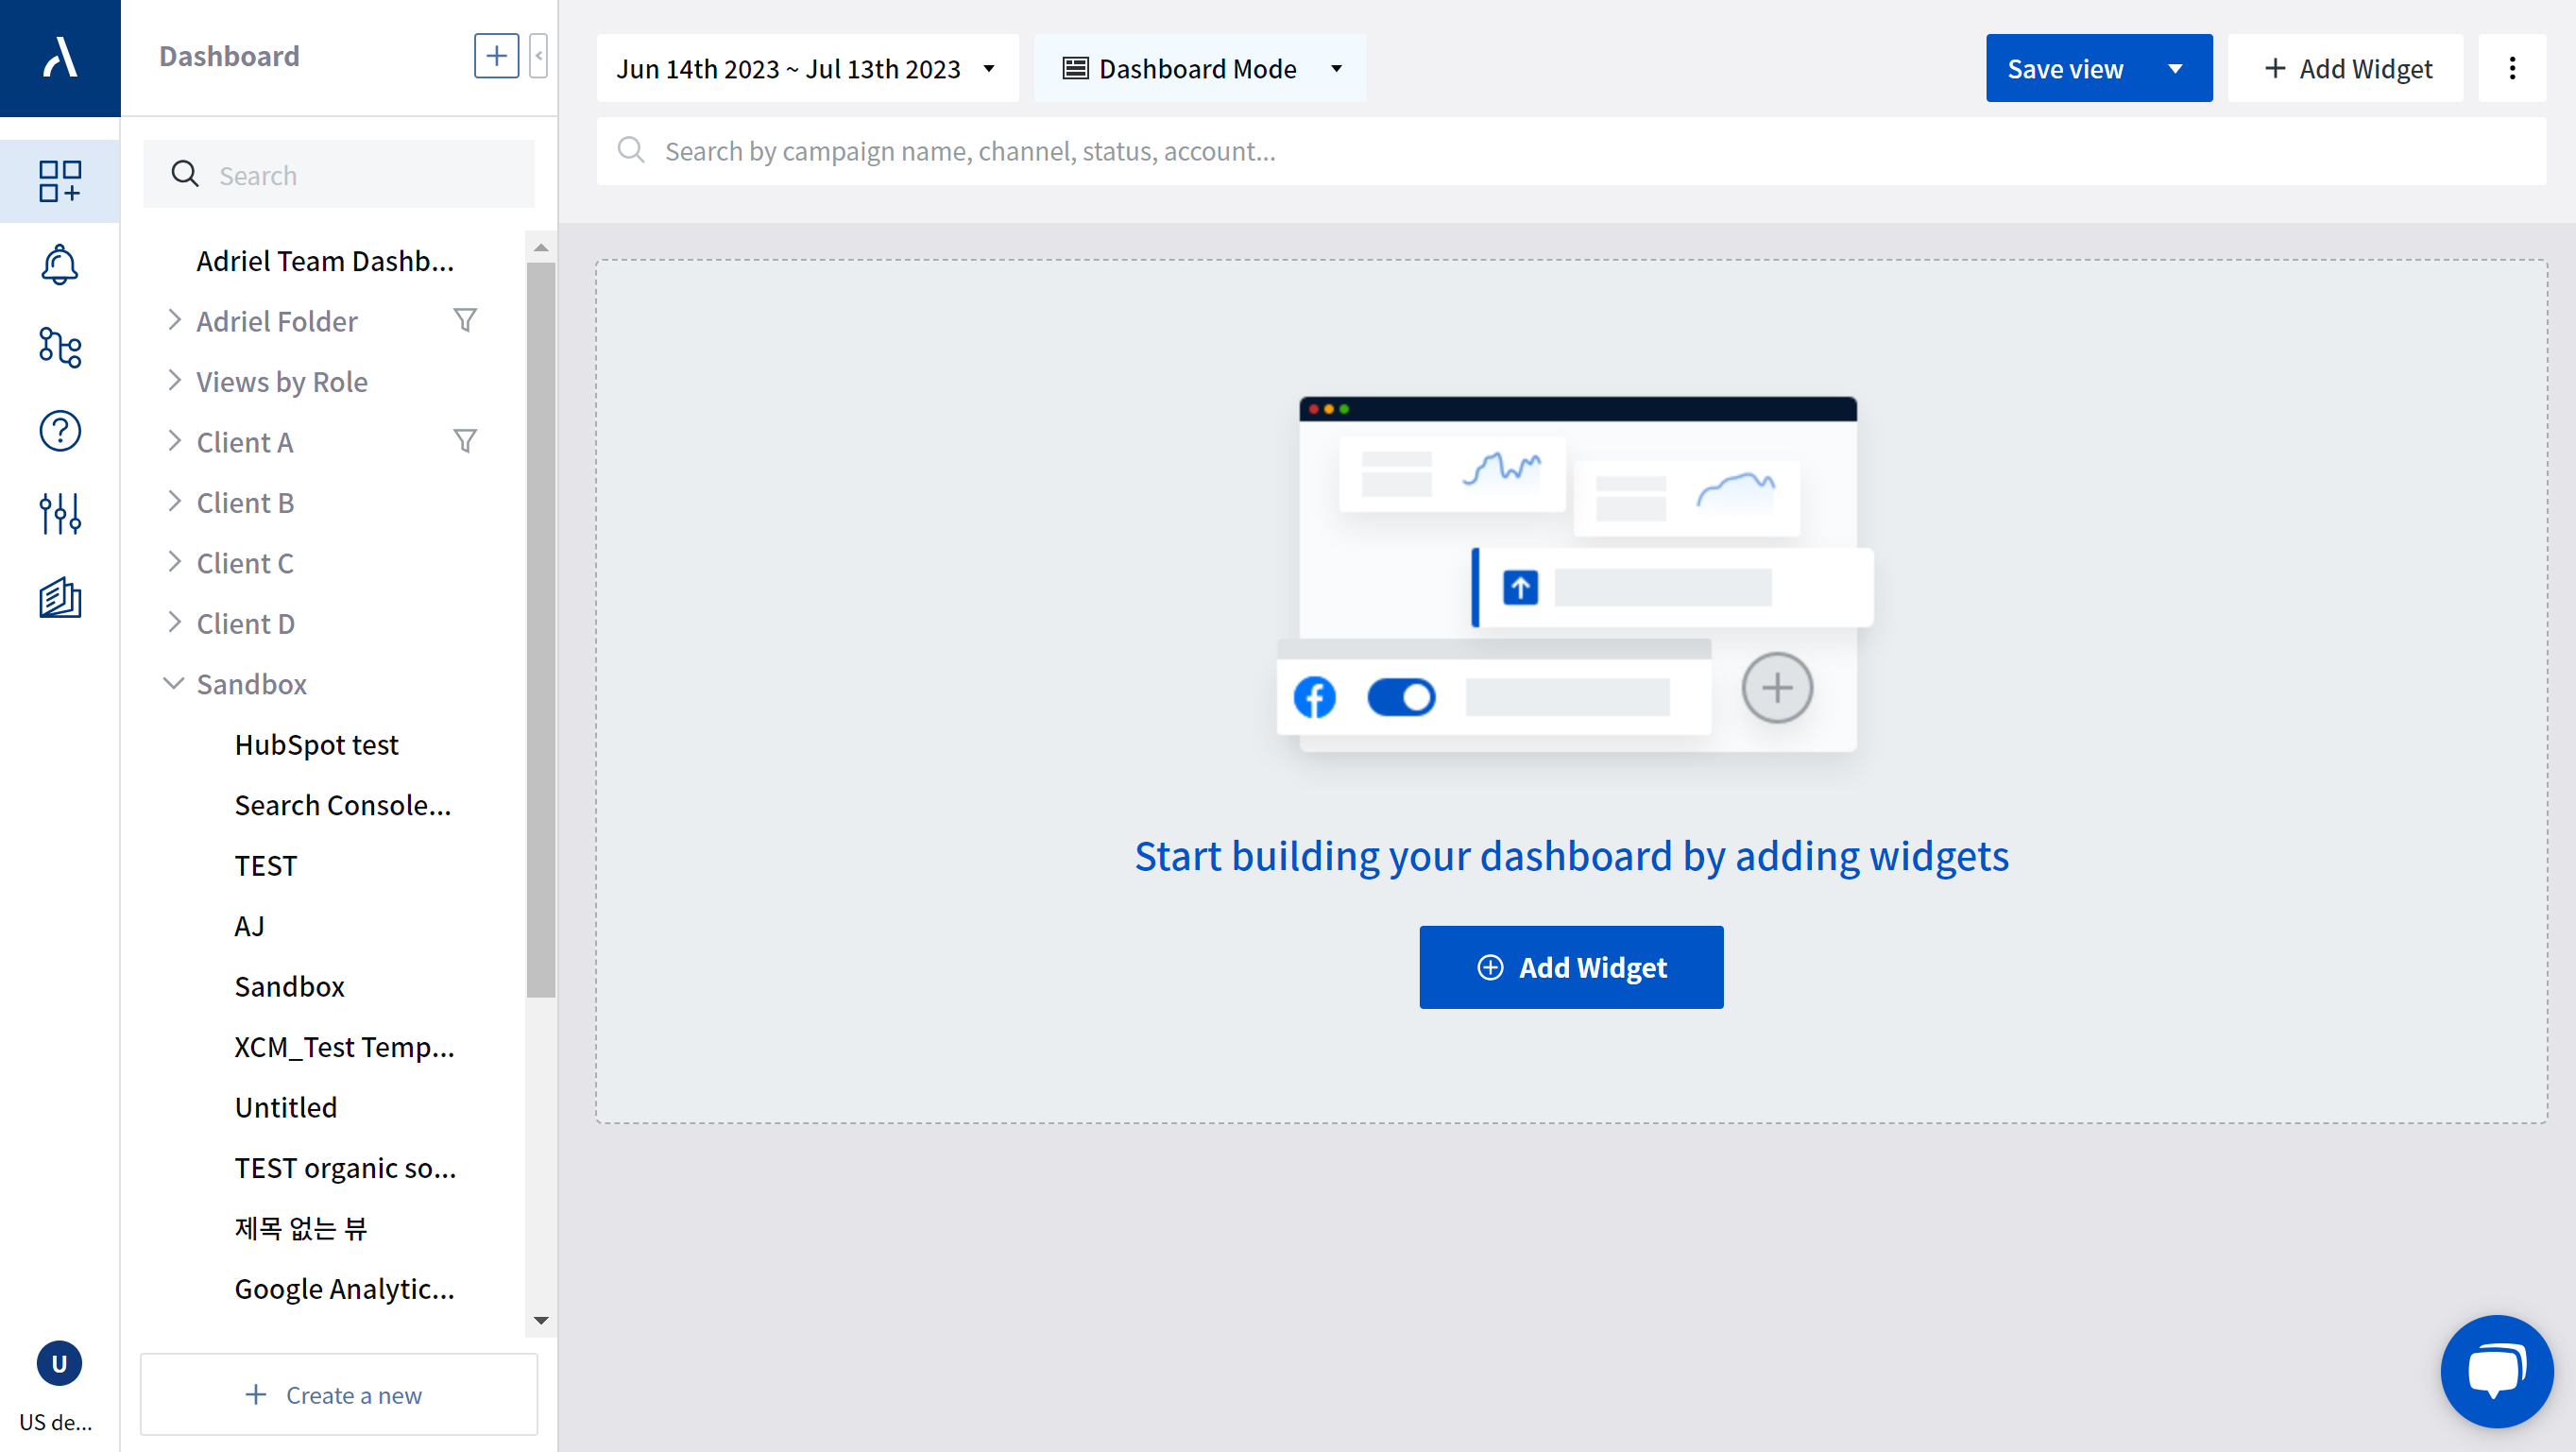
2. An empty view will be shown. Click one of the "+ Add a widget" buttons, then add an "Ads Table" by selecting the title card and dragging and dropping it into the workspace .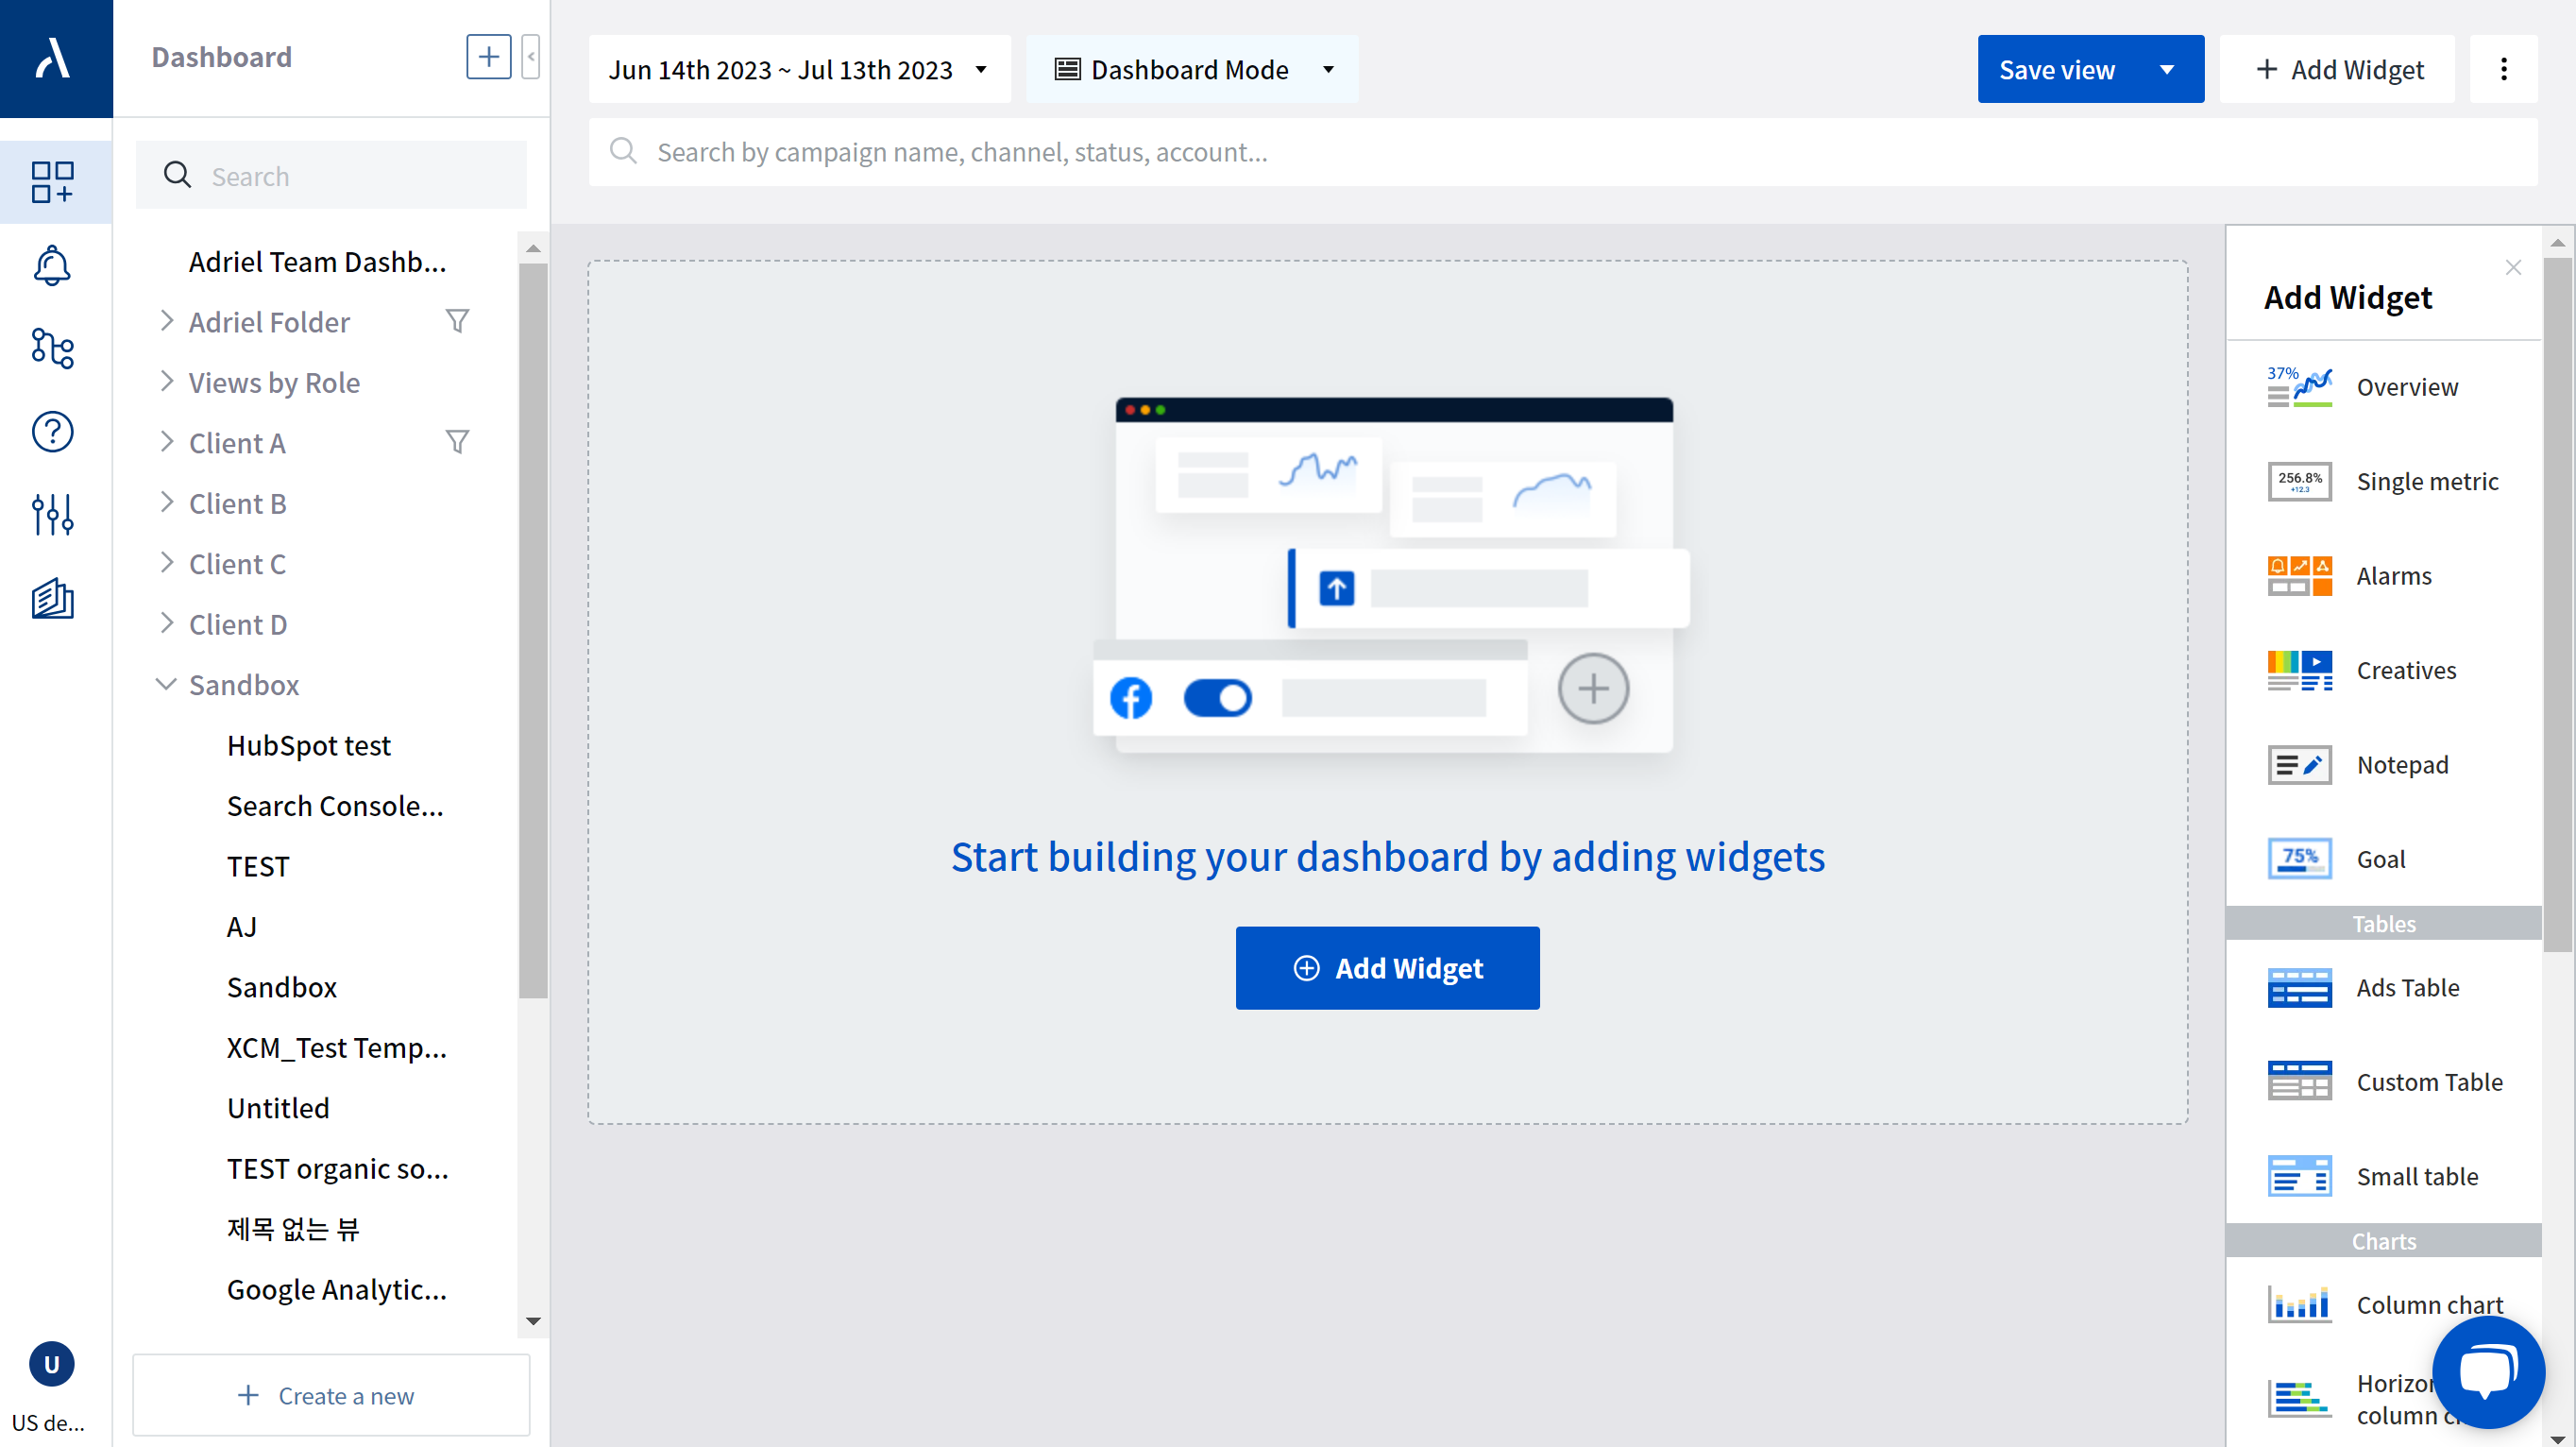
3. As soon as you drag and drop the name card, an auto-populated table will be visible in the workspace and the settings panel will pop-open to the right. To start with, all of your connections will be visible in this table; using the settings panel, you can choose the connections, breakdown, and metrics you want to see in this ads table. 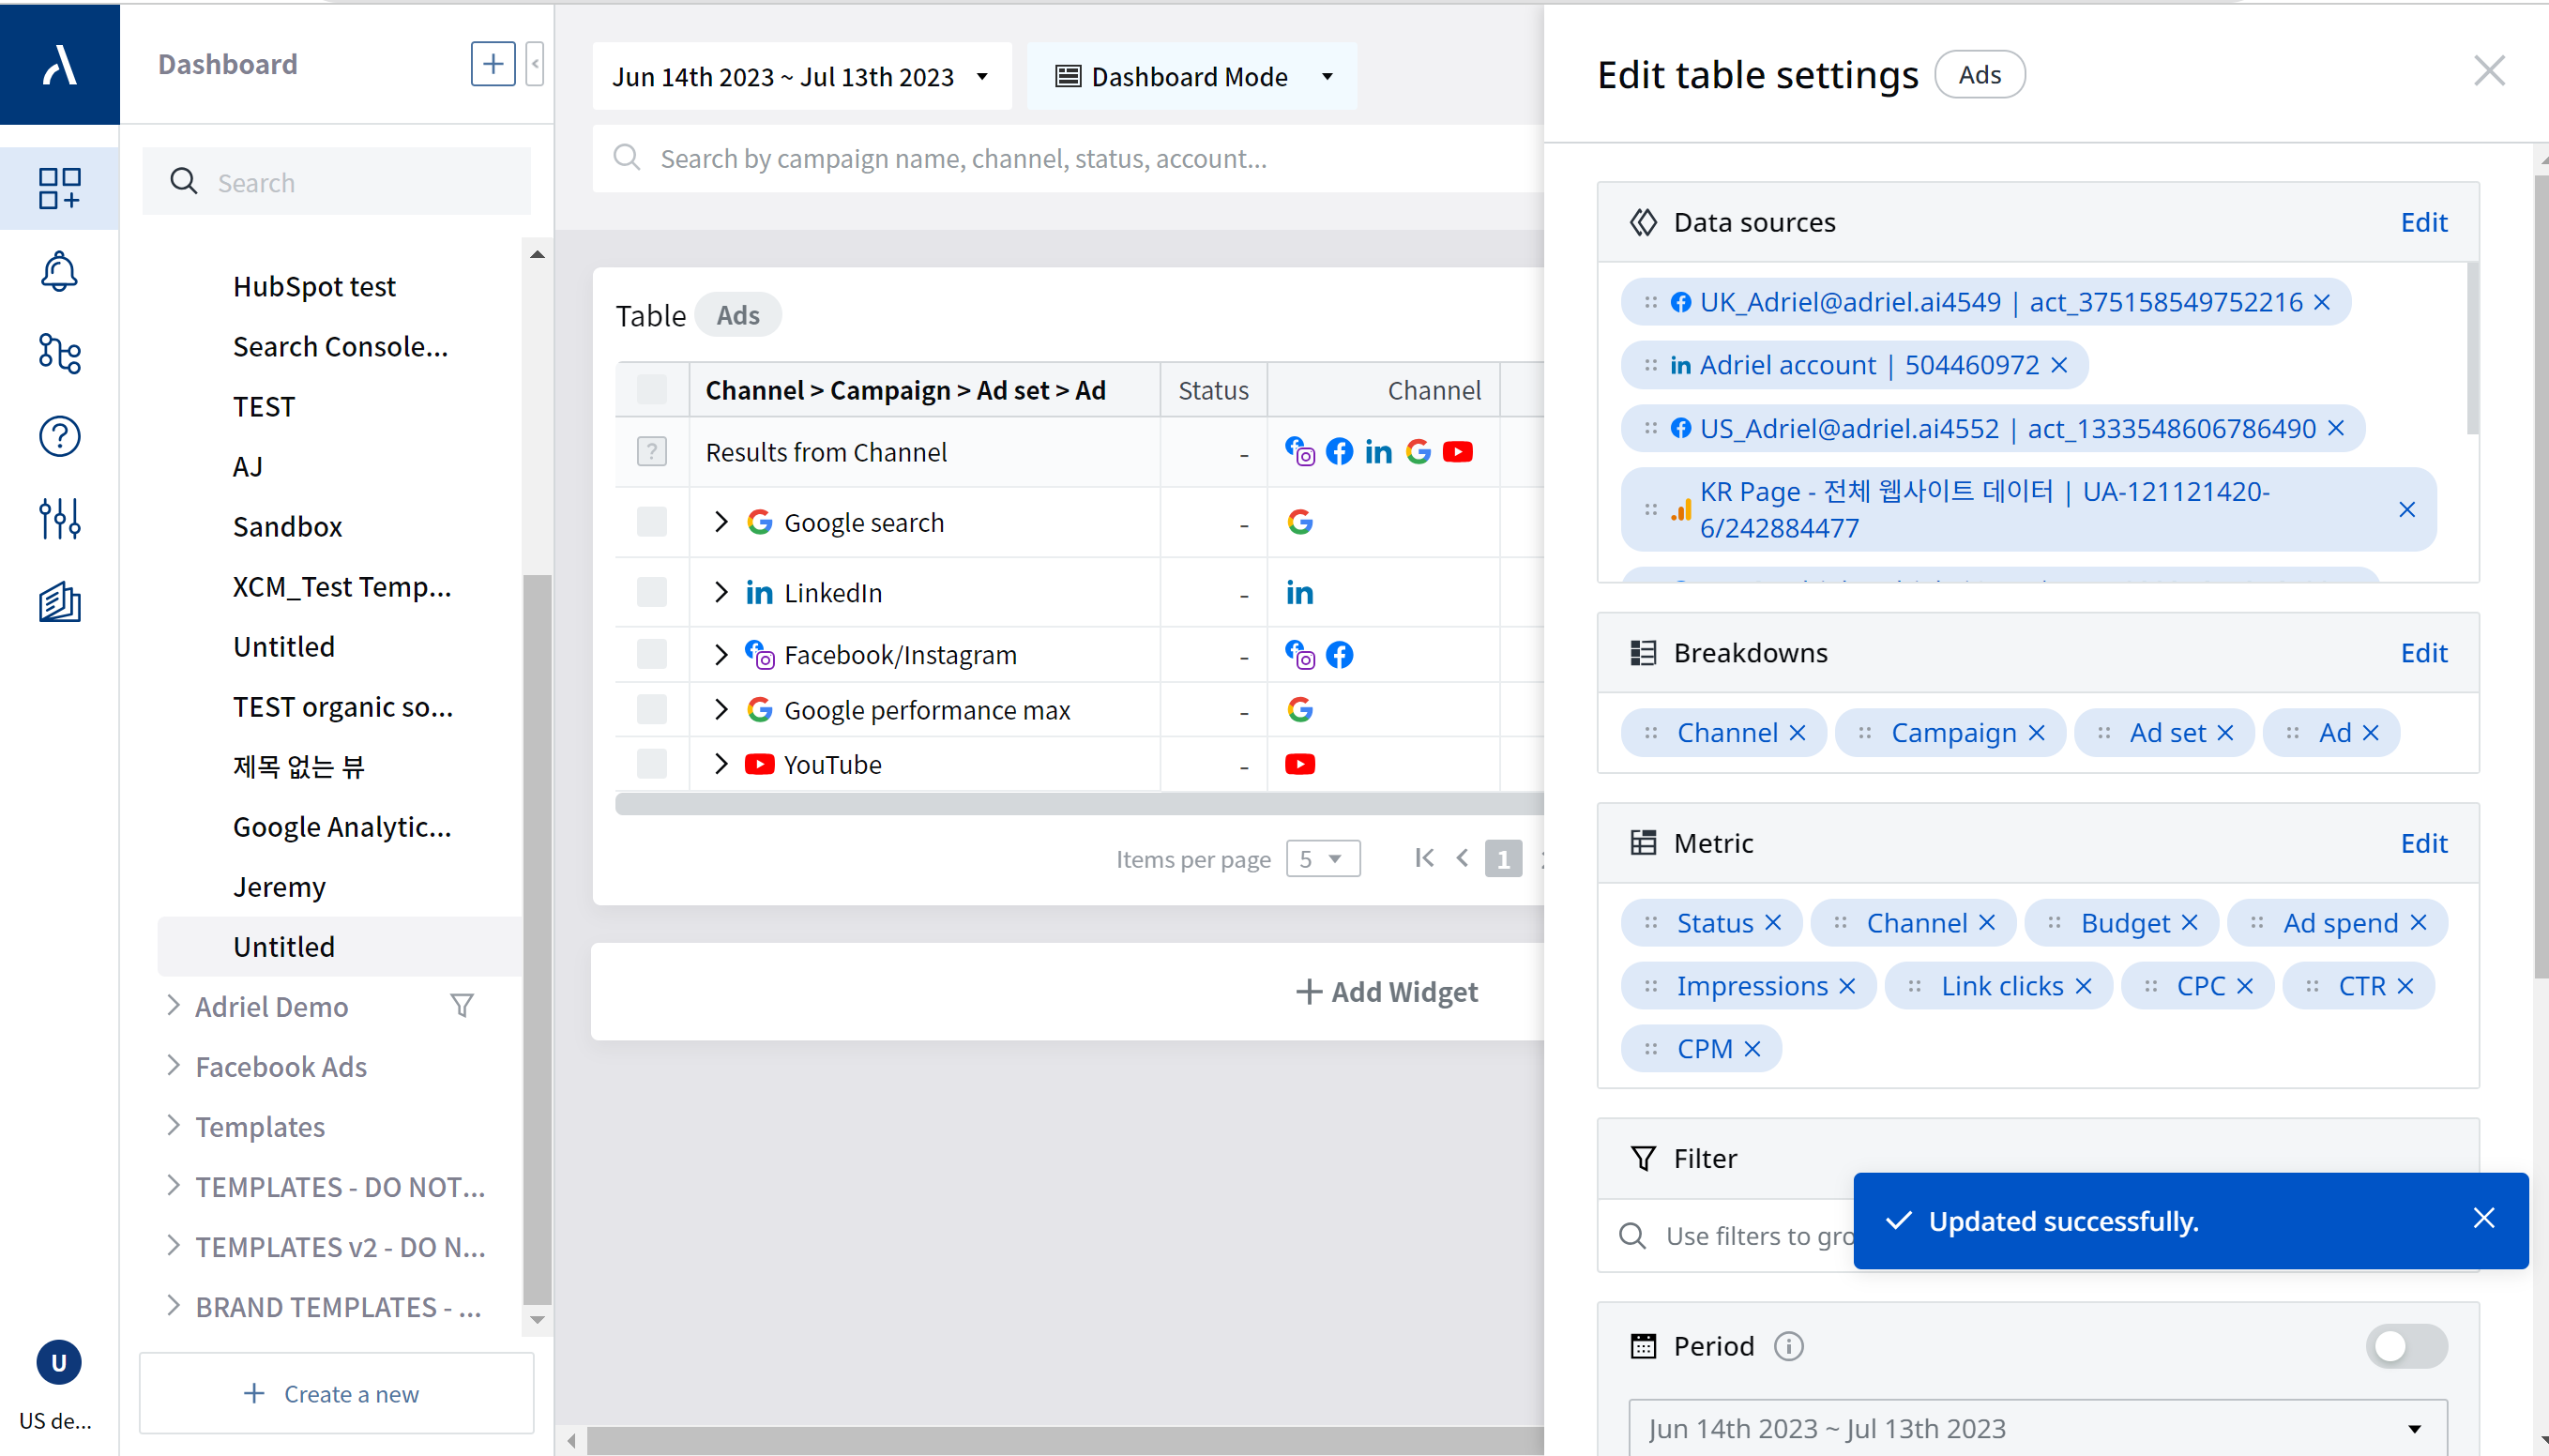
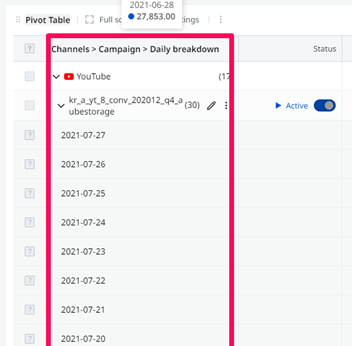
4. The Metrics in the Breakdown box are ordered as [Channels > Campaign > Ad set > ad] by default.
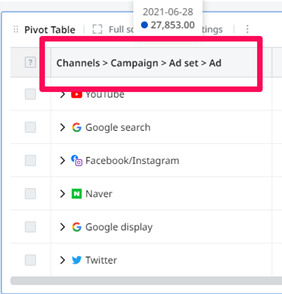
-
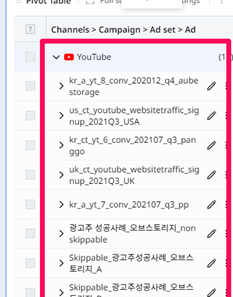
This means that if you click on a channel in the table, the list of campaigns in this channel will unfold. Then, if you click on one of the campaigns, an ad set list will unfold.
Now, how do I customize the table?
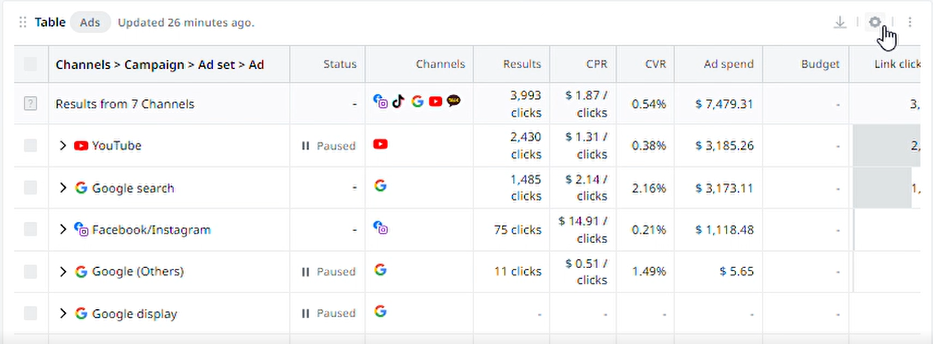
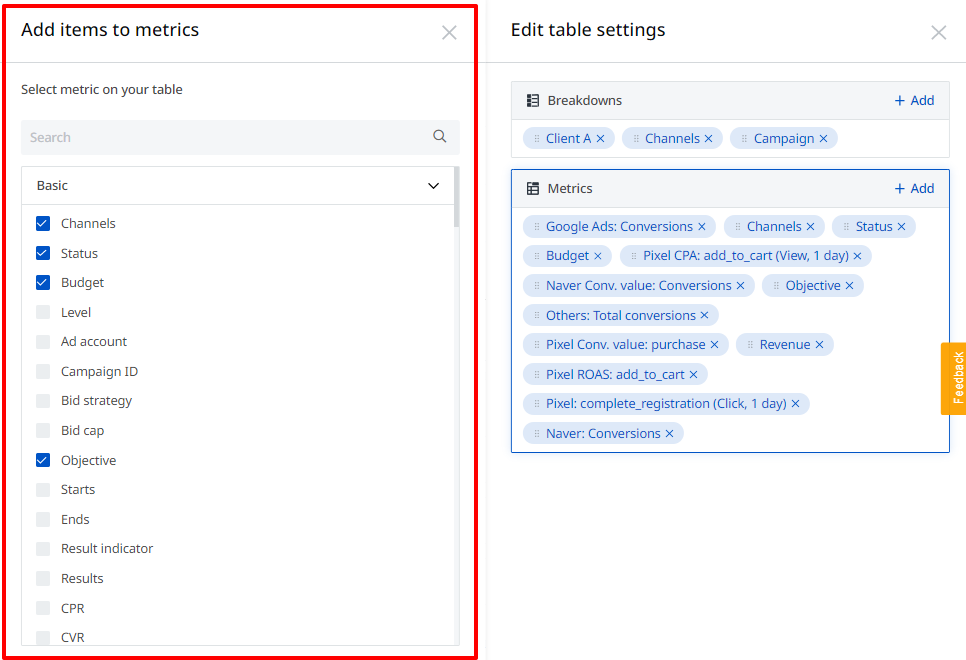
1. Hover on any table and click the Settings icon on the top of the table widget. An edit panel will open on the right.
2. You can see that the panel contains different metrics. To find a metric you want, click "+ Edit" next to 'Metrics', and find the metric on the list of its opened panel.
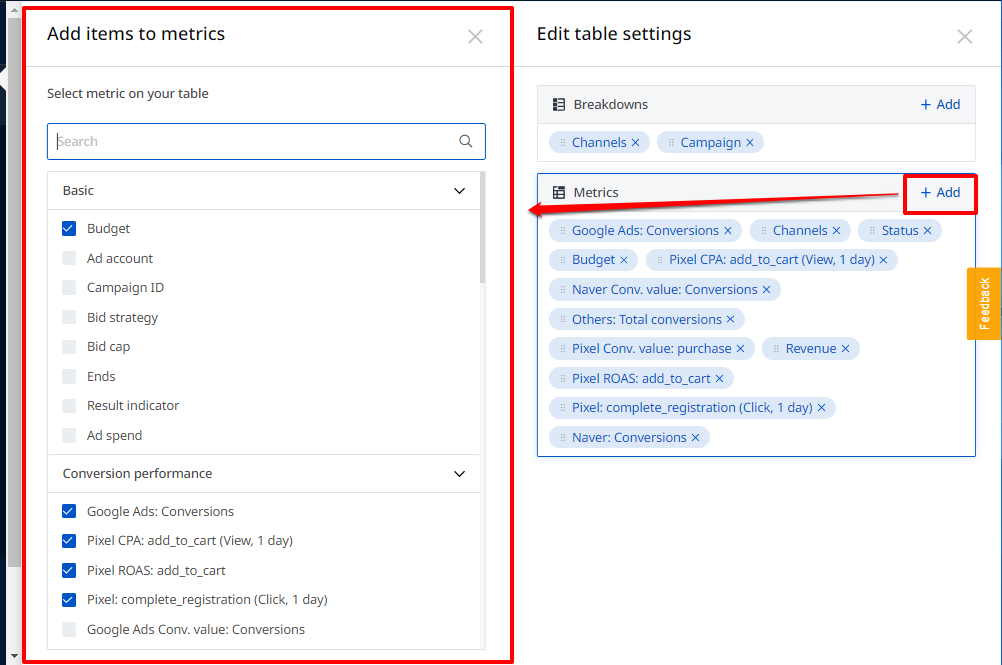
3. You can also browse the list of all metrics in the box under the search bar.
Metrics are categorized by:
-
Custom breakdowns
-
Basic
-
Clicks performance
-
Conversion performance
-
Reach performance
-
Video performance
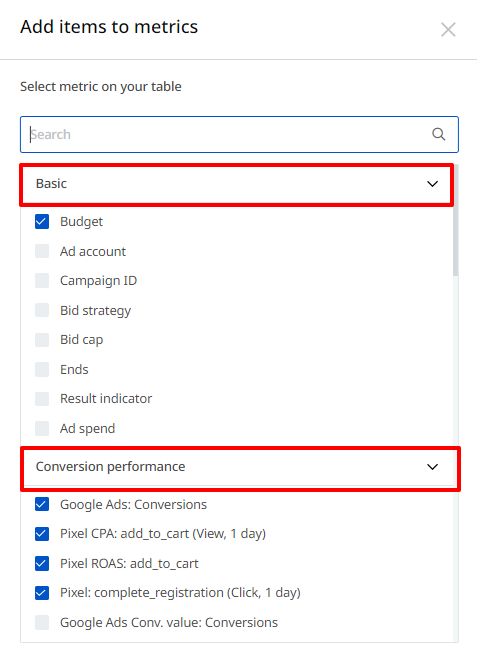
4. If you want to add a metric to the table columns, just click the metric.
5. Inside the metric box, you can change the order of the metrics displayed by using drag and drop.
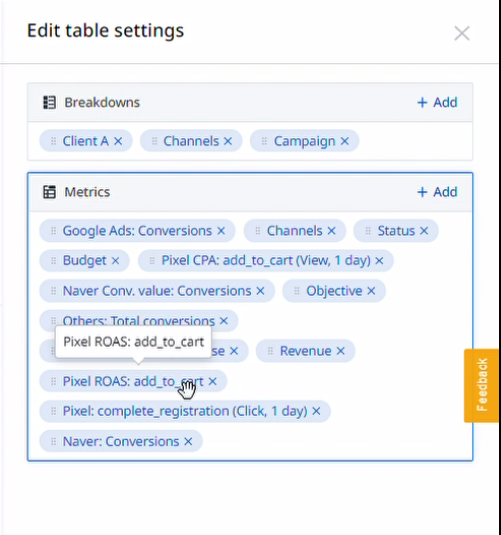
6. You can remove a metric by clicking on the "X" icon.
7. Click Apply to finalize the changes.
Utilize Breakdown to better customize your table.
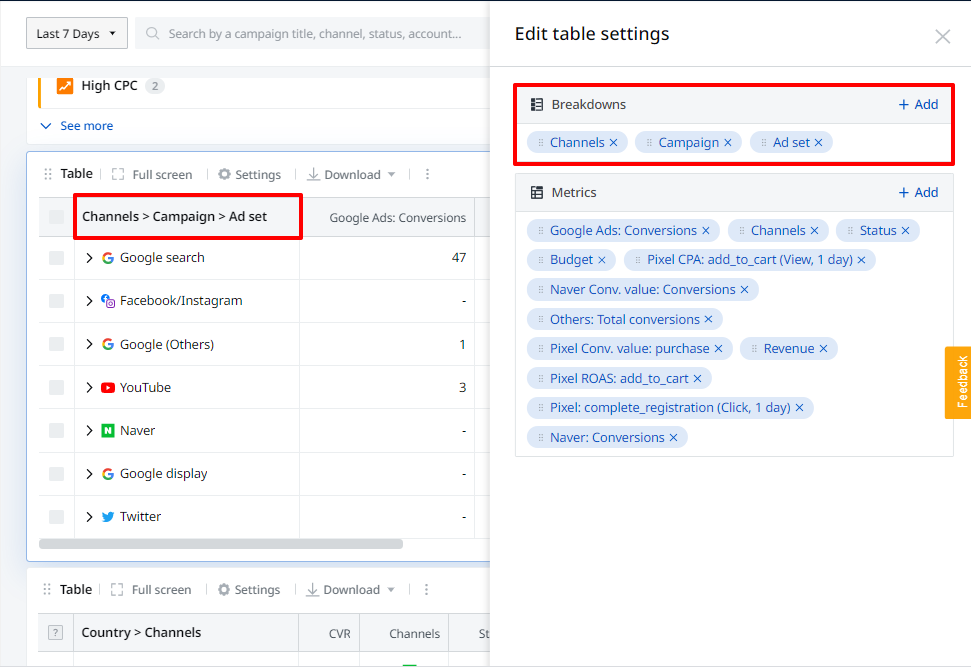
When you create a new table, the data appears as [Channels > Campaign > Ad set] in order as default. You can change this order and display data as you want it to appear on your table by using Breakdown.
1. Click Settings, and open the edit panel of the table.
2. Notice that breakdowns are displayed in the order: [Channels > Campaign > Ad set] in the Breakdown box.
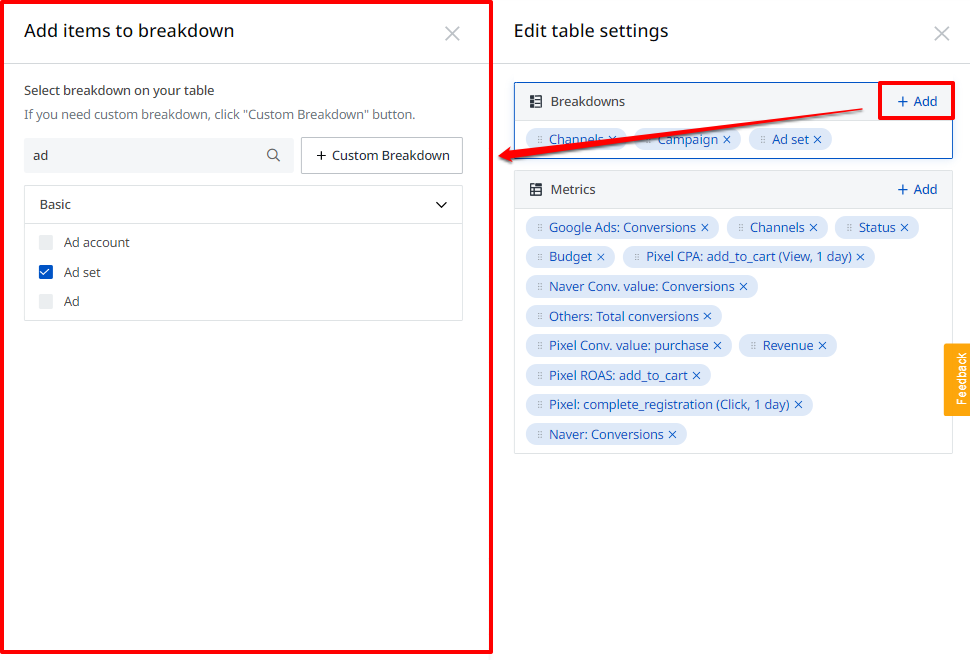
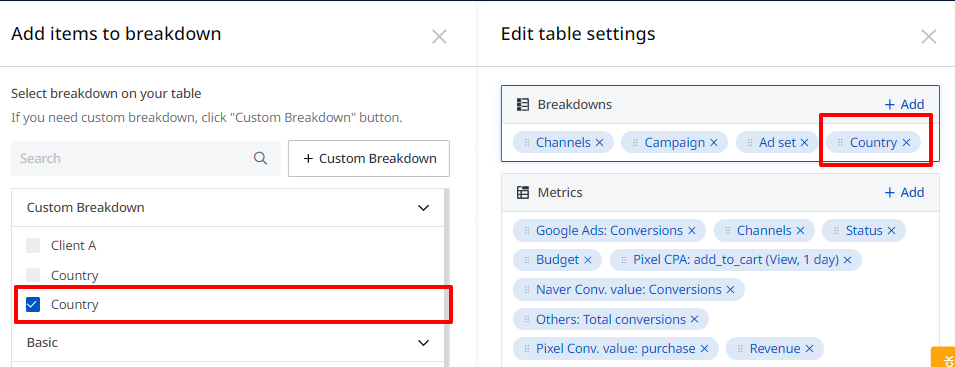
3. To create a breakdown, click "+ Edit" and open up a new panel.
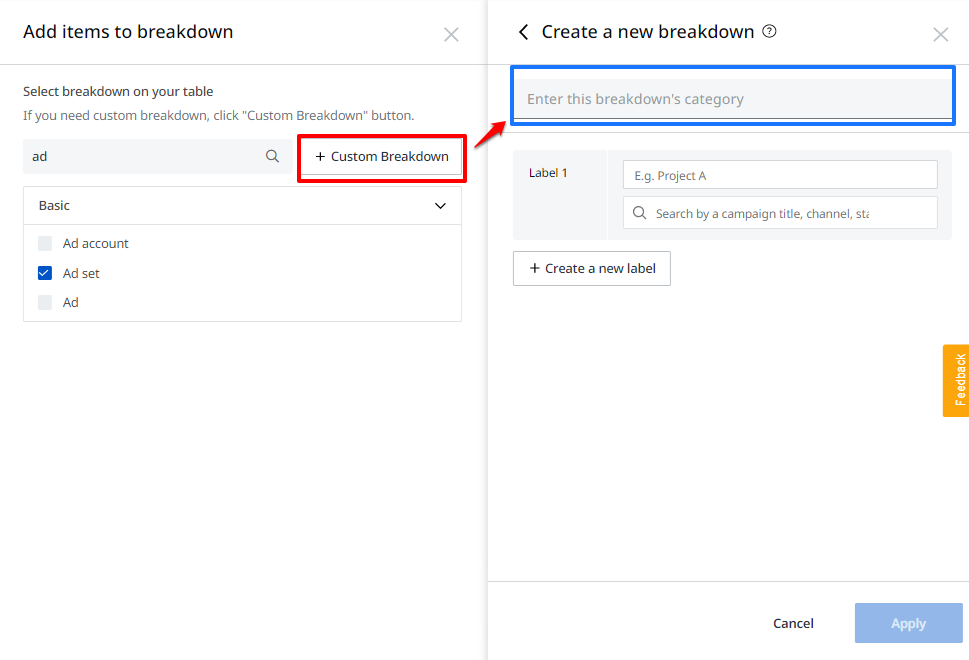
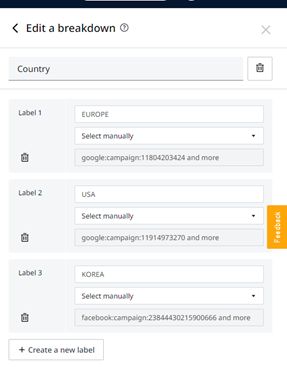
3. To create a custom breakdown, click + Custom Breakdown, then enter the category you would like to create. (Country, language, product, etc.)
4. Title the label, and select campaigns by filtering using up to more than three options: for example,
-
All campaigns with titles
-
All campaigns with UTM
-
Select manually
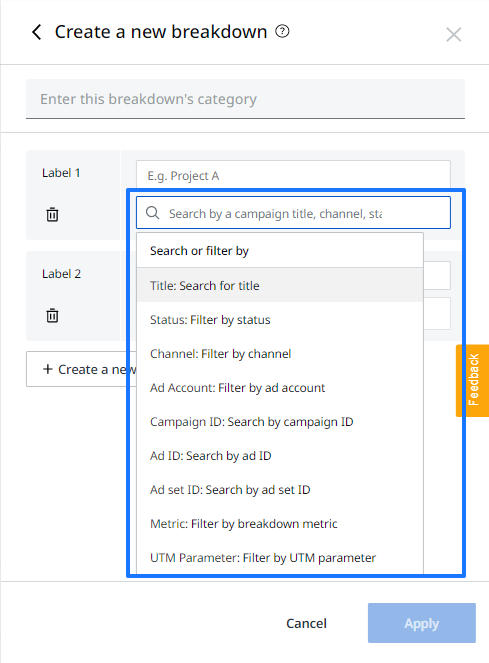
5. Click "+ Create a new label" if you want to create a new label.
(I created a new breakdown called “Country” and created three labels indicating different countries.)
6. Click Apply. You can see the edited Custom Breakdown
7. Click Apply, and the data is then displayed within the table, as you ordered in the breakdown box.
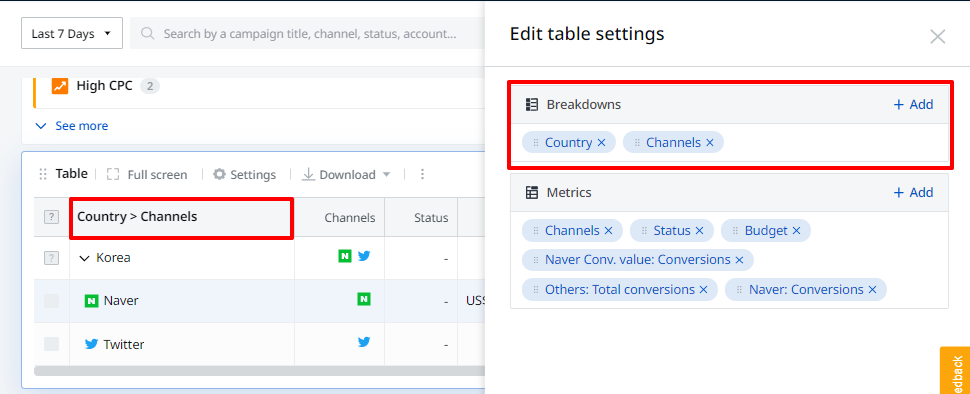
-
For data that is not applicable to the designated label filter, it will be displayed with “Unlabelled” added to its name.
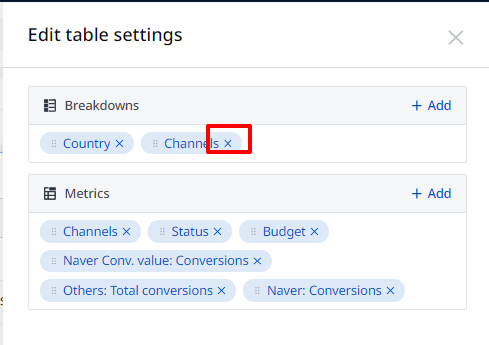
8. To edit or remove the created breakdown metric, open the panel again, hover your cursor over the item, and click on the "Pencil" icon.
That's all!
Indicators that need to be reviewed in order to evaluate the performance of your campaign may be set in more detail according to your business goals. You can add as many ads table as you require in each view.
Now, time to create your own tables. Go to your dashboard and start to explore!