- Adriel Academy
- Business Intelligence: Adriel Dashboard
- Utilizing the Dashboard Widgets
-
Getting Started with Adriel BI
-
Data Source Hub
- Overview: Connecting Data Sources
- Flexible Integrations - File Sharing / Data Base
- Adform
- Airbridge
- Amazon Ad Server (Sizmek)
- Amazon Ads
- Amazon DSP
- Amplitude
- Apple Search Ads
- AppsFlyer
- Awin
- Basis
- Branch
- Buzzvil
- Cafe24
- Coupang
- Criteo
- Facebook Page Organic
- Godomall
- Google Ads
- Google Ad Manager (GAM)
- Google Analytics 4 (GA4)
- Google Business Profile (GBP)
- Google Campaign Manager 360 (CM360)
- Google Display & Video 360 (DV360)
- Google Search Console (GSC)
- Google Sheets
- HubSpot
- Instagram Organic
- Instagram Public
- Kakao
- Klaviyo
- LinkedIn Ads
- LinkedIn Organic
- Mailchimp
- Matomo
- Meta Ads (formerly Facebook Ads)
- Microsoft (Bing) Ads
- Mobon
- Moloco
- Naver
- Outbrain
- Pinterest Ads
- Quantcast
- Quora Ads
- Reddit Public
- Salesforce Reporting
- Semrush
- Shopee
- Shopify
- Singular
- Sistrix
- Snapchat Ads
- Spotify Ads
- StackAdapt
- Taboola
- Targeting Gates
- Teads
- TikTok Ads
- TikTok Organic
- TikTok Public
- Unity Ads
- Walmart Connect
- WooCommerce
- X (Twitter) Ads
- X (Twitter) Organic
- Yahoo Ads
- Yahoo DSP
- Yelp Ads
- YouTube Analytics
- YouTube Public
-
Business Intelligence: Adriel Dashboard
-
Your Team
-
FAQ
Using non-advertising custom tables
In addition to the ads table, the Adriel dashboard also offers tables for customized data.
For table (Custom), only analytics accounts can be added. If the table type is ‘Custom’, you can only select data sources that belong to ‘Analytics’, such as GA, Appsflyer, and Spreadsheet.
Learn how to customize a Table (Custom)
The currently available data sources are Google Analytics, Appsflyer, and Spreadsheet.
-
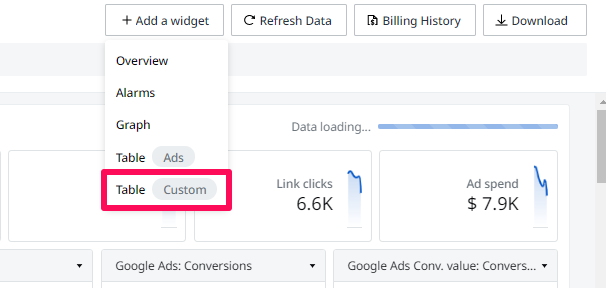
Click "+ Add a widget", then add a table (Custom)
-
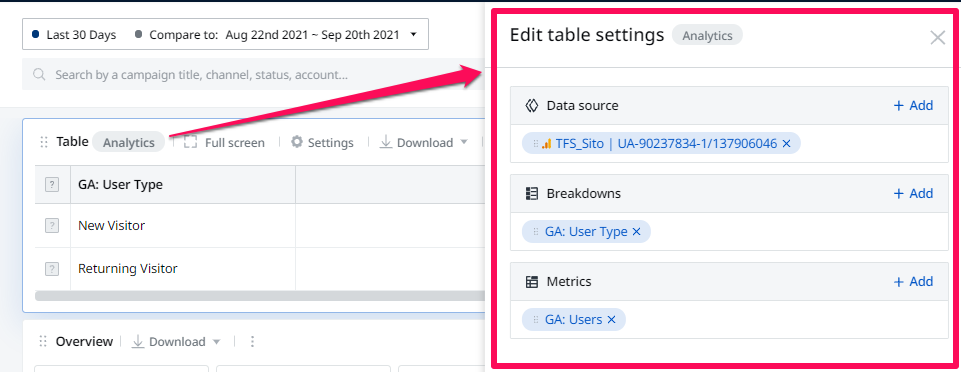
You will see that a new Table (Custom) has been added with a panel that has been opened on the right-hand side.
![](https://academy.adriel.com/hubfs/Knowledge%20Base%20Import/downloads.intercomcdn.comio4153404362f43fe40e485c8496347ee4f1.png)
![](https://academy.adriel.com/hubfs/Knowledge%20Base%20Import/downloads.intercomcdn.comio405589762393dc5966e95833cc6e041db2.png)
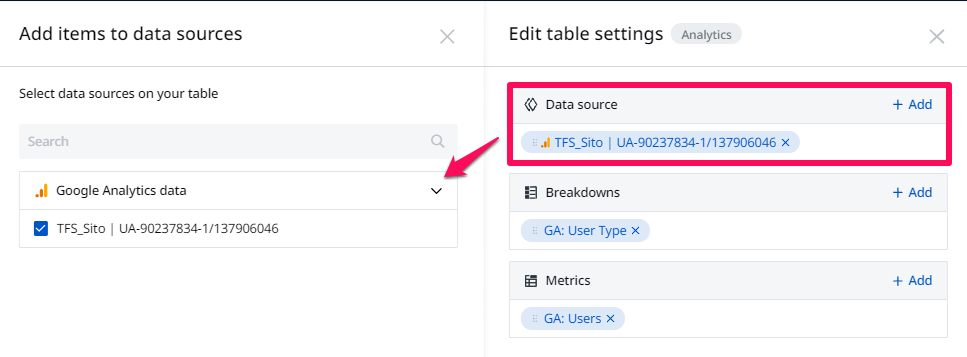
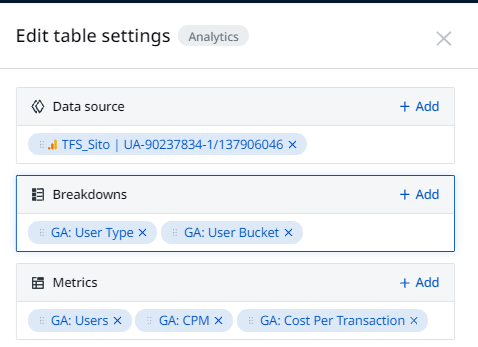
3. In the panel, you can customize the data sources which you would like to edit or remove from the analytics table. Click the Data source box and select it from the list.
You may not select Google Analytics, Appsflyer, and Branch at the same time.
![](https://academy.adriel.com/hubfs/Knowledge%20Base%20Import/downloads.intercomcdn.comio405625868799fab8255bf8ac0f2780d2f4.png)
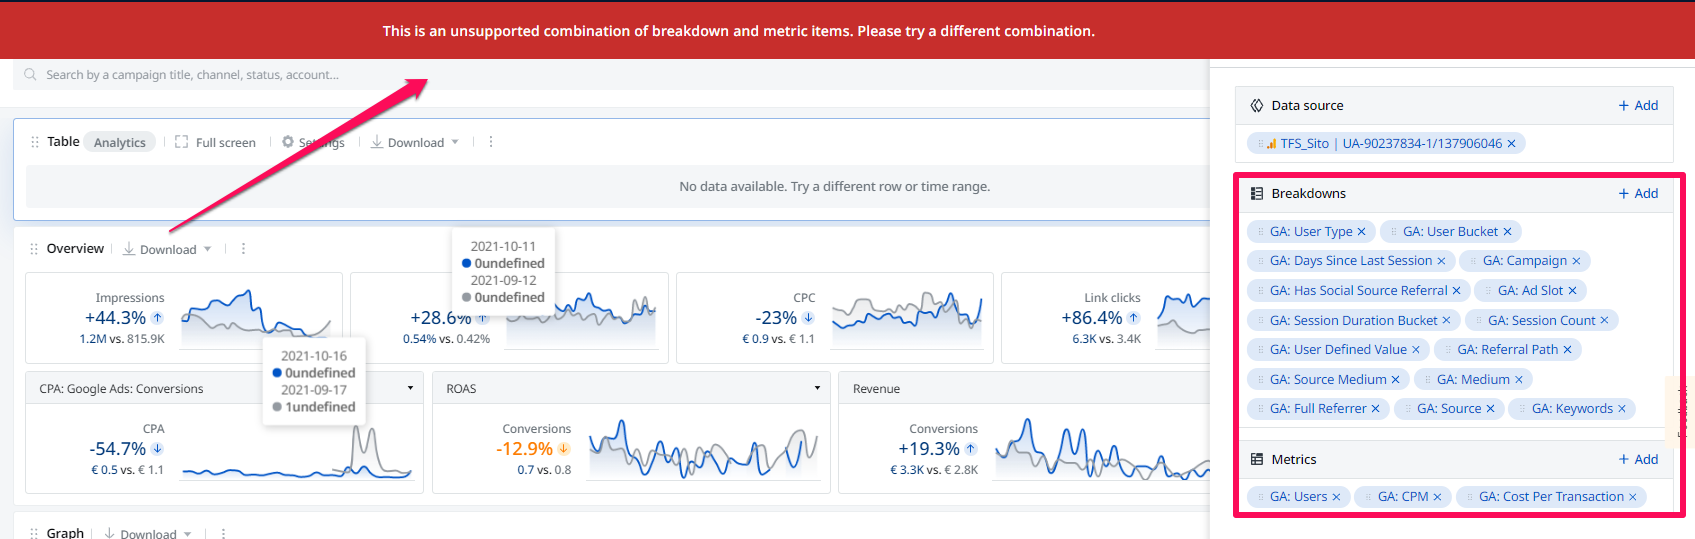
4. You will also able to customize the breakdowns and metrics which they want to edit or remove from the analytics table.
![](https://academy.adriel.com/hubfs/Knowledge%20Base%20Import/downloads.intercomcdn.comio405625946d178efacb5de7cebffd2e3485.png)
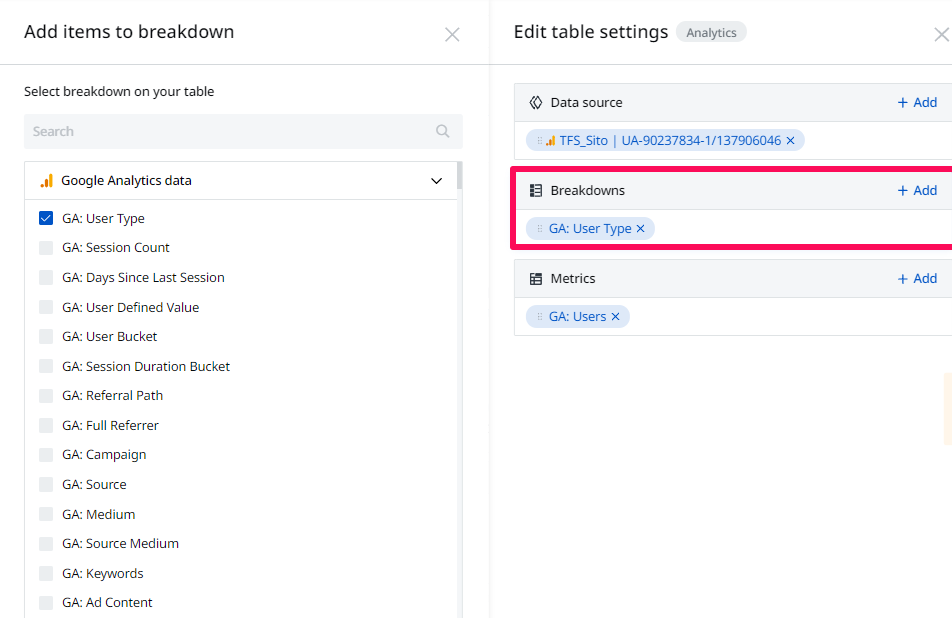
5. You can select, unselect, or drag any of the items present.
![](https://academy.adriel.com/hubfs/Knowledge%20Base%20Import/downloads.intercomcdn.comio405626480e7303e5e912ce2a58824b5f51.png)
6. If you select breakdown or metric combinations that cannot visualized in the same table, you will see the following message.
![](https://academy.adriel.com/hubfs/Knowledge%20Base%20Import/downloads.intercomcdn.comio405628200cc1c59e8aed64393c58c050f1.png)