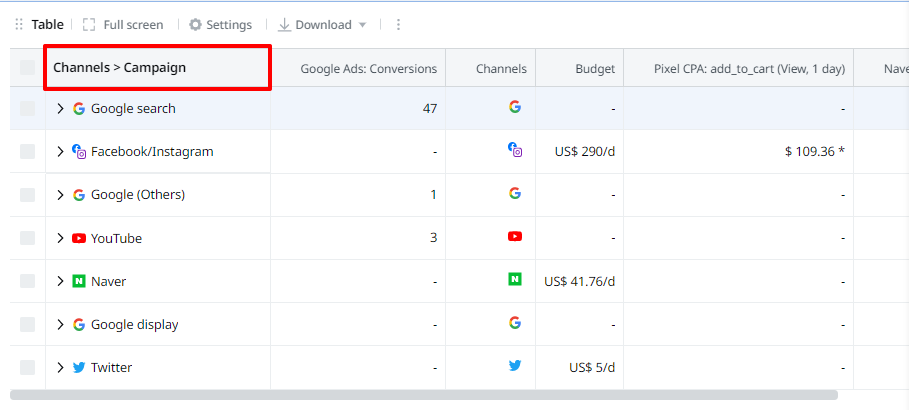
Check how your data is displayed.
The default display ordered is [Channel > Campaign].
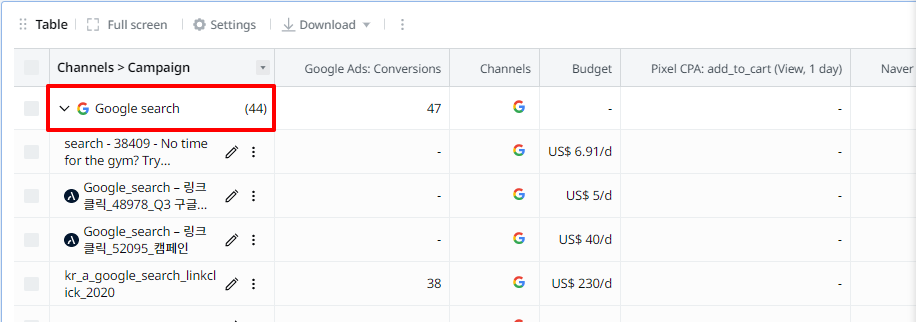
When you open a channel, the campaigns which belong to that channel will be shown.
Resize each metric
You can check the metric names in the first row. Each metric width can be resized simply by dragging the lines between metrics found in the first row
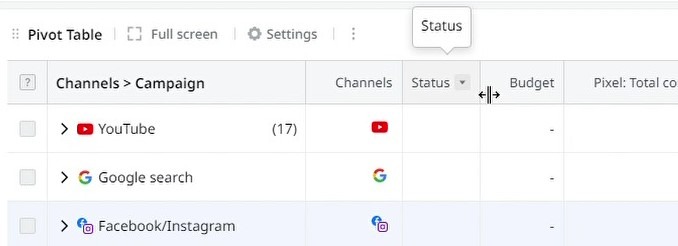
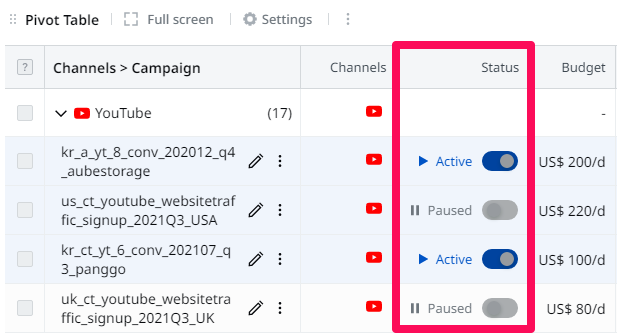
Check which campaigns are active, paused, or deactivated.
You can check the status of each campaign, check the Status metric. You can pause or activate campaigns for available channels.
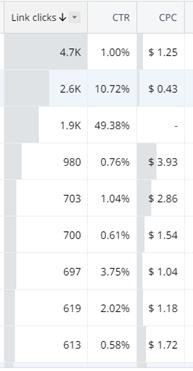
Bar graph
The data bars interlayered on some metrics visually represent how each row is performing as compared to the others.
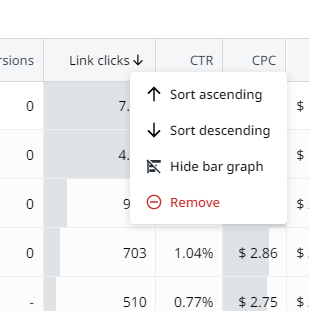
Hover your mouse over each metric and a small icon will appear. Click the icon to open the dropdown menu below with the following options:
-
Sort ascending
-
Sort descending
-
Hide / Display with bar graph
-
Remove
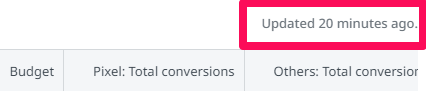
To know when data has been updated, check the specific time in the upper left-hand part of the table.
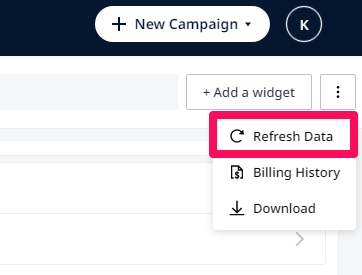
Refresh data to update data.
If you wish to bring the latest data, click the Refresh data button located in the upper right-hand corner.
Set goals and compare the values.
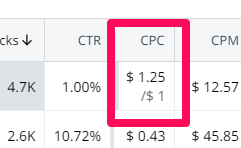
You can set goals for some metrics: CTR, View rate, CPC, CPV, CPM. To insert a goal value, simply click on the data box and enter it.
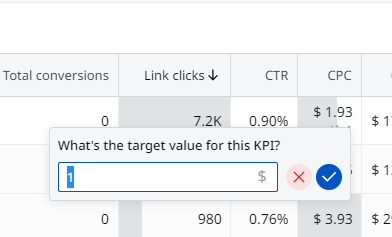
When the goal value which you set is below or equal to the data value, it will be shown as gray. When the goal value you set is above the data value, it will be shown in blue.
To learn how to customize your table, click here.